
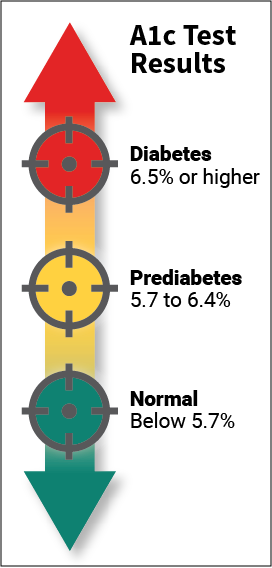
Type 2 diabetes is a chronic condition that affects the way the body metabolizes sugar (glucose). With type 2 diabetes, the body either resists the effects of insulin (a hormone that regulates the movement of sugar into cells) or it doesn't produce enough insulin to maintain normal glucose levels. Type 2 diabetes occurs more commonly in middle-aged and elderly people. Uncontrolled it can cause all sorts of very bad things: infections, damaged kidneys, vision loss and blindness, amputations and many more. So, there is no question that type 2 diabetes needs to be taken seriously and treated. Type 2 diabetes is usually diagnosed using the glycated hemoglobin (A1C) test. This blood test indicates the average blood sugar level for the past two to three months. Normal levels are below 5.7 percent, and a result between 5.7 and 6.4 percent is considered prediabetes. An A1C level of 6.5 percent or higher on two separate tests means you have diabetes.
People who have diabetes need this test regularly to see if their levels are staying within range and if they need to adjust their diabetes medicines. To treat type 2 diabetes lifestyle changes are very effective, and the side effects of eating more healthfully and staying more active are positive ones. In this project I will try to predict A1C levels: no-diabetes, pre-diabetes and diabetes. I will transform the dataset from a regression task (A1C) into a multi-class classification task (3 A1C levels). Notebook of this article can be found in this link : https://github.com/mohcinemadkour/Type-2-Diabetes-Risk-Prediction
Diabetes Dataset
These data are courtesy of Dr John Schorling, Department of Medicine, University of Virginia School of Medicine which can be obtained from http://biostat.mc.vanderbilt.edu/DataSets.
The data consist of 19 variables on 403 subjects from 1046 subjects who were interviewed in a study to understand the prevalence of obesity, diabetes, and other cardiovascular risk factors in central Virginia for African Americans. According to Dr John Hong, Diabetes Mellitus Type II (adult onset diabetes) is associated most strongly with obesity. The waist/hip ratio may be a predictor in diabetes and heart disease. Type 2 Diabetes is also associated with hypertension - they may both be part of Metabolic Syndrome.
Metabolic syndrome is a collection of risk factors that includes high blood pressure, high blood sugar, excess body fat around the waist, and abnormal cholesterol levels. The syndrome increases the chance of developing heart disease, stroke, and diabetes. Aside from a large waist circumference, most of the disorders associated with metabolic syndrome have no symptoms. Losing weight, exercise, and dietary changes can help prevent or reverse metabolic syndrome. According to a national health survey, more than 1 in 5 Americans has metabolic syndrome. The number of people with metabolic syndrome increases with age, affecting more than 40% of people in their 60s and 70s.
The 403 subjects were the ones who were actually screened for diabetes. Glycosolated hemoglobin (A1C) > 7.0 is usually taken as a positive diagnosis of diabetes.
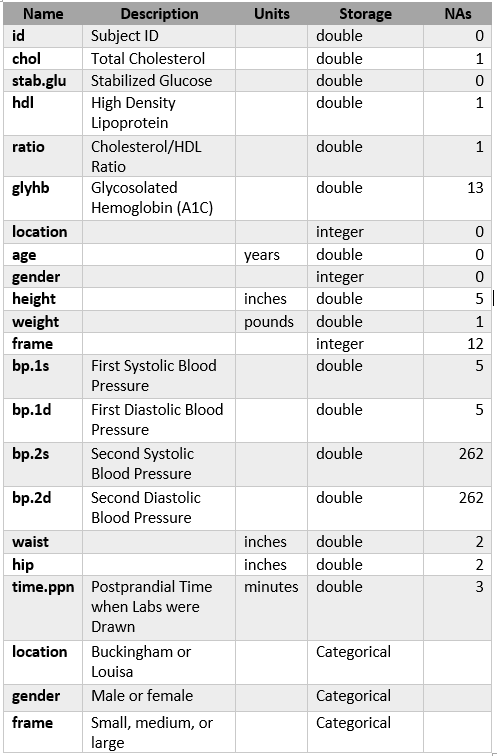
Description of Features:
There are 403 observations and 19 features in this dataset, maximum # NaNs:262.
Challenges
I was facing two challenegs with my dataset:
- relatively small number of observations
- imbalanced classes (A1C levels)
To overcome the issues with imbalanced data, I will use several techniques:
- f1 macro averaged score for performance metric
- cost-sensitive learning (penalize algorithms)
- SMOTE - Synthetic Minority Over-sampling Technique
and several machine learning algorithms:
- L_1-regularized Logistic Regression
- L_2-regularized Logistic Regression
- Support Vector Machine (SVM)
- Random Forest
- Gradient Boosting
- AdaBoost
All together, I have trained 22 models.
Findings
- From my limited sample I could not find any single condition that would alone increase the risk for type 2 diabetes.
- I found that several factors could impact risks for the person to be diagnosed with diabetes: age, high cholesterol ratio, high blood presure, increased weight...
- Even if you have all these conditions it does not mean you will have type 2 diabetes. This will make very difficult for my models to predict A1C levels.
- Due to imbalanced data, all models had problems with predicting minority classes: pre_diabetes and diabetes. They were mostly predicting the majority class, no_diabetes.
- At the end, I found that Random Forest algorithm with cost_sensitive learning did the best with f1 macro score of 0.56.
Exploratory Analysis
- The feature names got changed to make more sense
- As I expected, there are 403 observations and 19 features in the data set.
- There are 16 numerical features and 3 categorical features. All data types are correct
Unused Features
To make dataframe easily readable I will remove unused features like id and location.
The goal of this project is to predict ranges of A1C. From a quick look through my dataframe I could see that the postprandial time when labs were drawn varies. So, let's check its distribution.
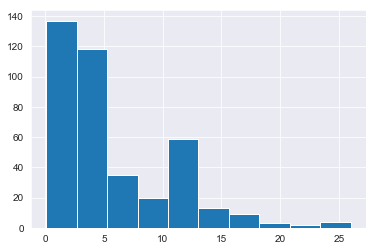
Since the postprandial time when labs were drawn has very wide range, from 5 minutes to 26 hours, I could remove stab_glu and time_ppn features.
The number of features has been decreased to 15.
Distributions of Numeric Features
Plotting the histogram grid
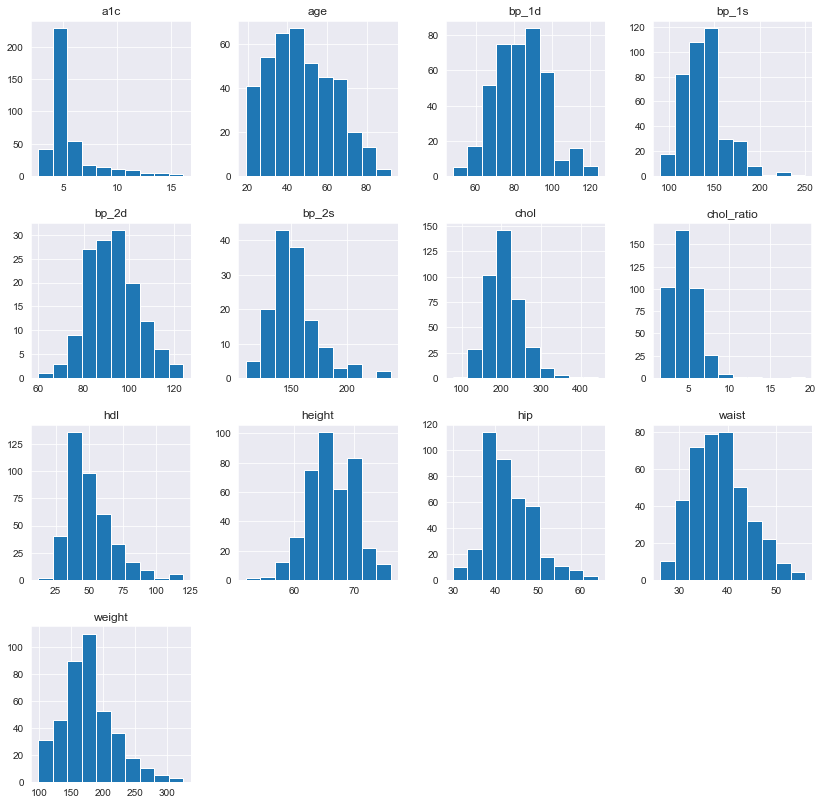
All distributions look OK. Only for a1c I could see many observations around 5% (healthy range). This might be an indication of imbalanced data classes once I transfer a1c to 3 classes.
Summary statistics for the numeric features
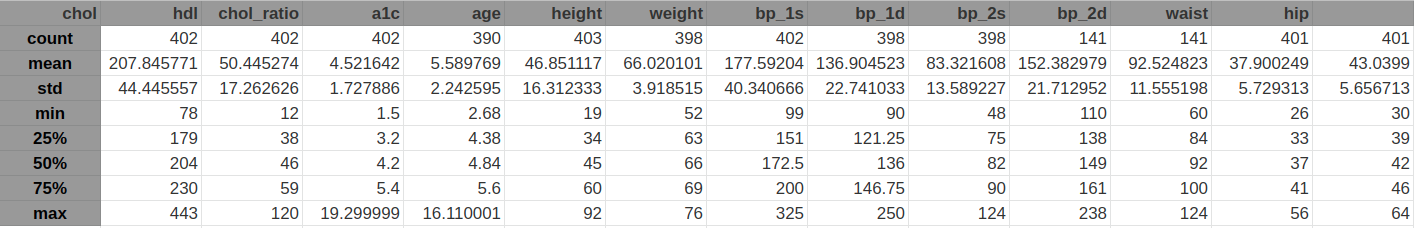
From the summary statistics and the visualizations I can conclude that all features look OK. I do not see any extreme values for any feature.
This time I can see from the plot and from grouping that average a1c increases with body frame size.
I will keep all outliers. They just represent high and, for some observations, extreme values of a1c.
Correlations
Let's calculate correlations to take a look at the relationships between numeric features and other numeric features.
I are going to sort features in order of their correlation with a1c. This will make easier to see stronger correlations for a1c.
It is not easy to digest this big dataframe. Let's use Seaborn's .heatmap() function to visualize the correlation grid.
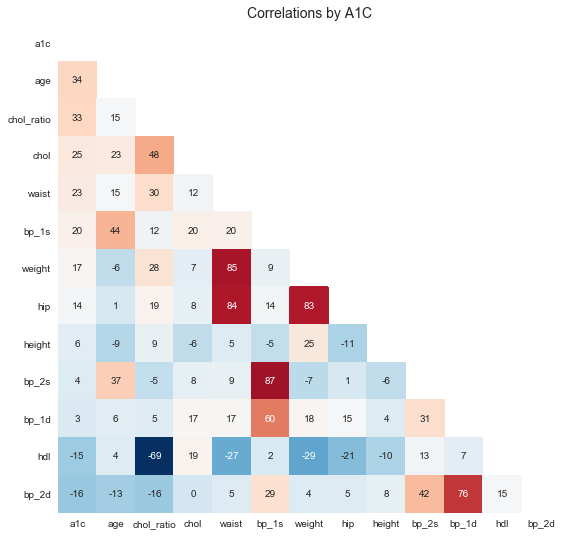
I can see few obvious stronger correlations: * weight and waist and hip * blood presure measurements * cholesterol ratio and chol and hdl
But there are only few week correlations with a1c: * chol_ratio, age, waist ...
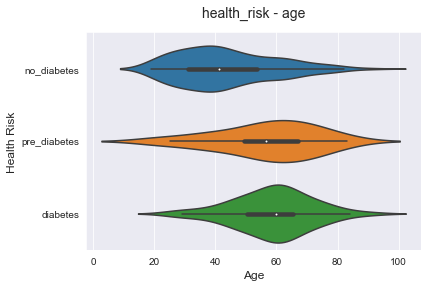
The above plot is showing us that age is one of the key factors for diabetes risk. The age median and mean for risk classes are separated, but the variance is so high. That means that I have to look at many other factors that could contribute to higher risks for diabetes.
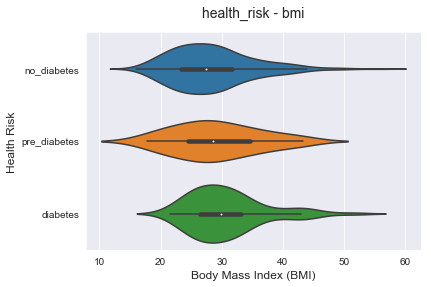
Similar to the previous plot, higher bmi could lead to diabetes risk increase. But the variance is high and there is no strong direct correlation for that.
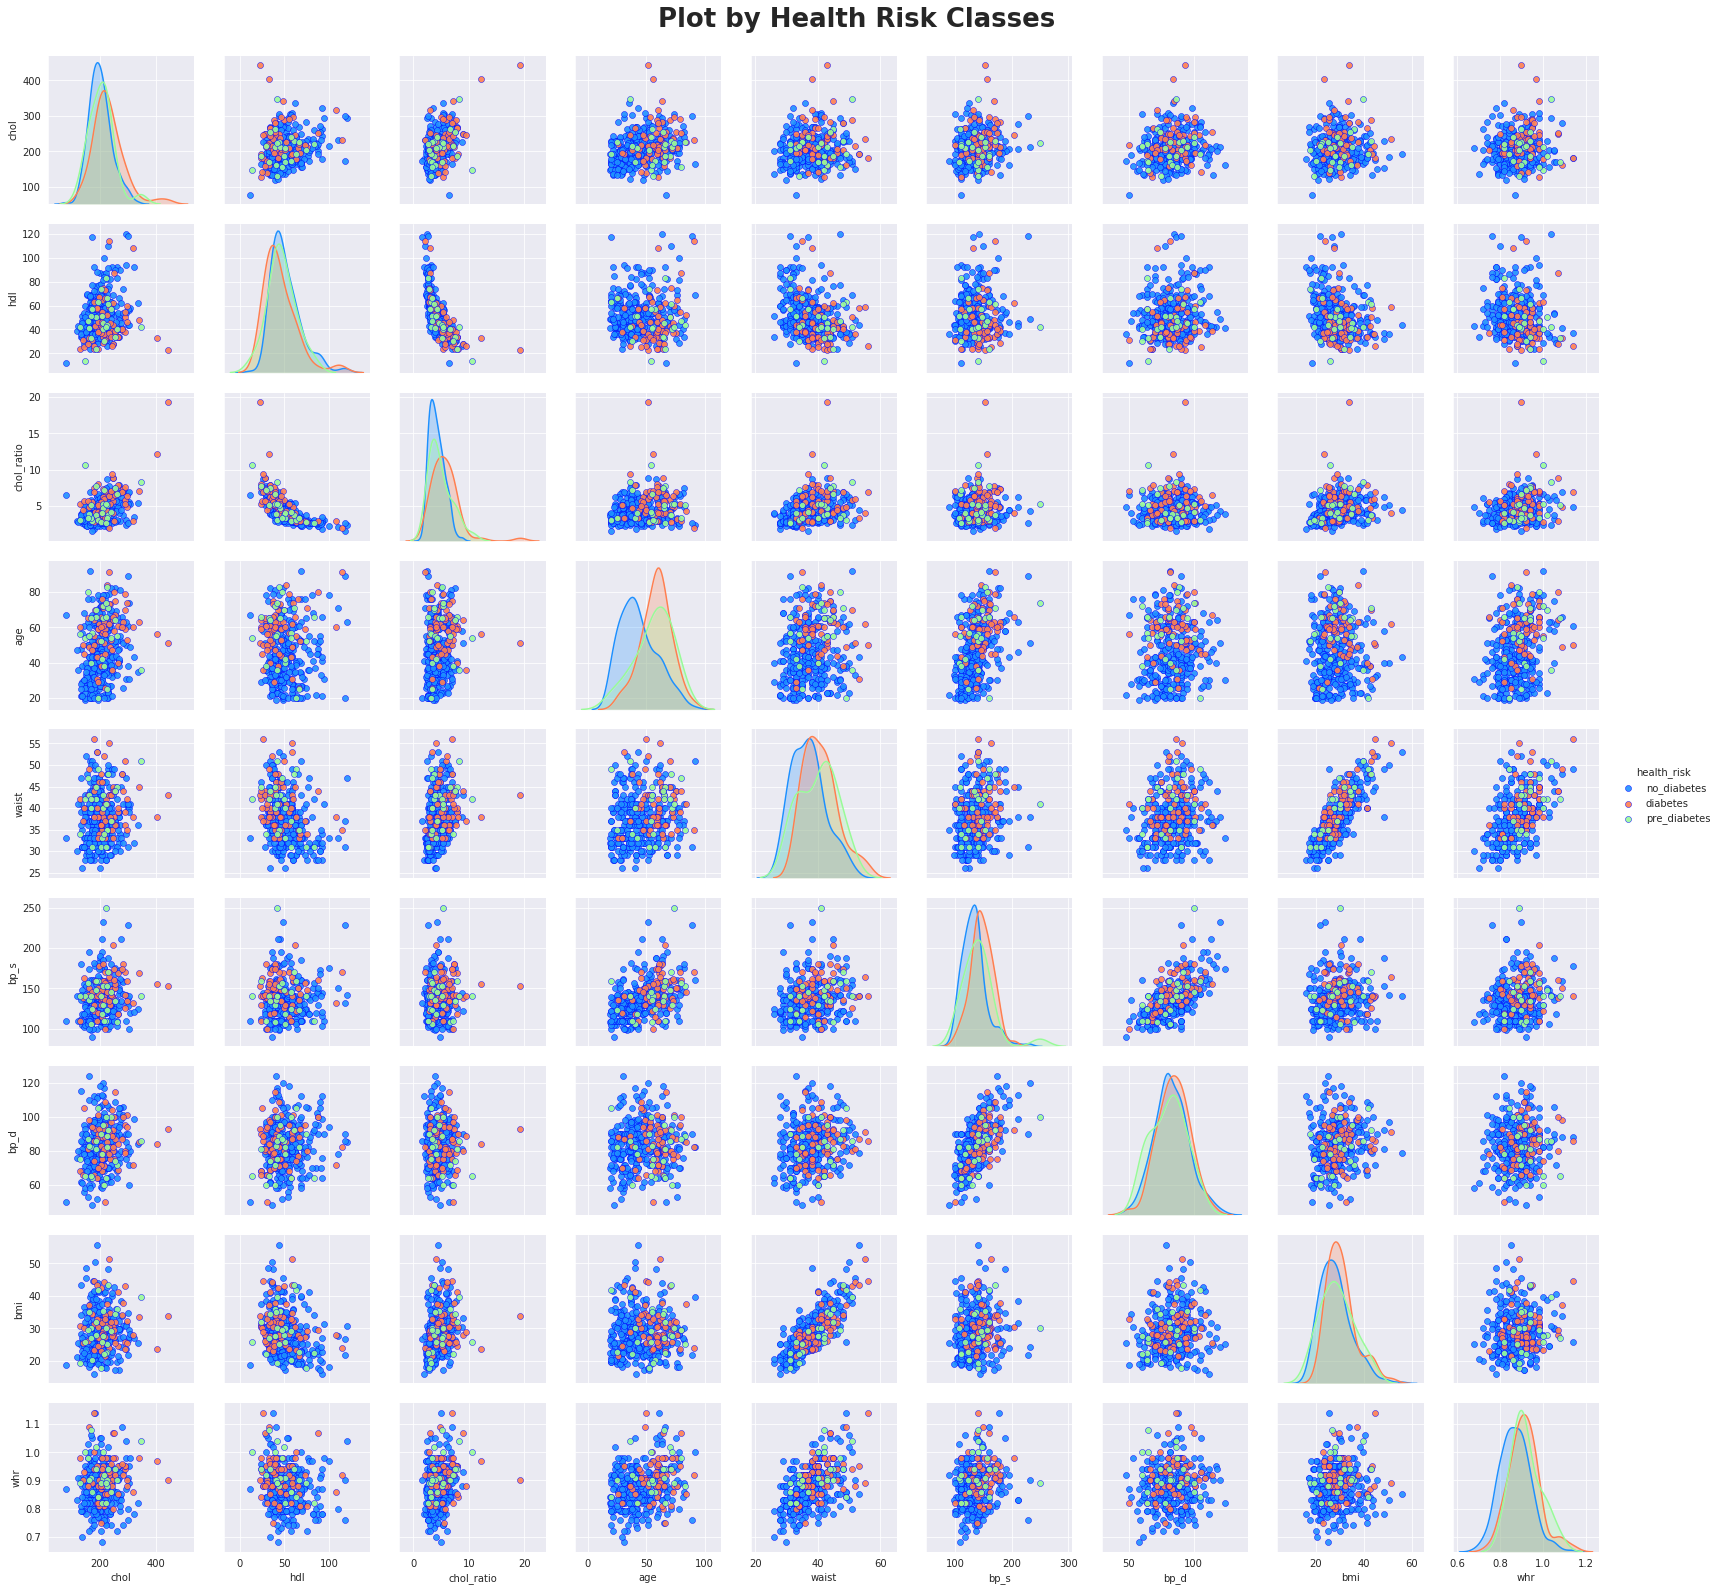
Let's now plot a bivariate segmentation for bmi and age segmented by health_risk.
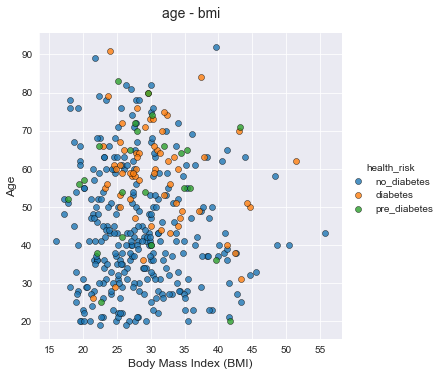
From this chart I can see less diabetes and pre_diabetes observations and more no_diabetes observations for lower age and lower bmi.
Algorithm Selection
I have transformed the original dataset to the multi-class classification task. The chosen algorithms are all known to work well in this kind of task:
- L_1-regularized Logistic Regression
- L_2-regularized Logistic Regression
- Support Vector Machine (SVM)
- Random Forest
- Gradient Boosting
- AdaBoost
Insights & Analysis
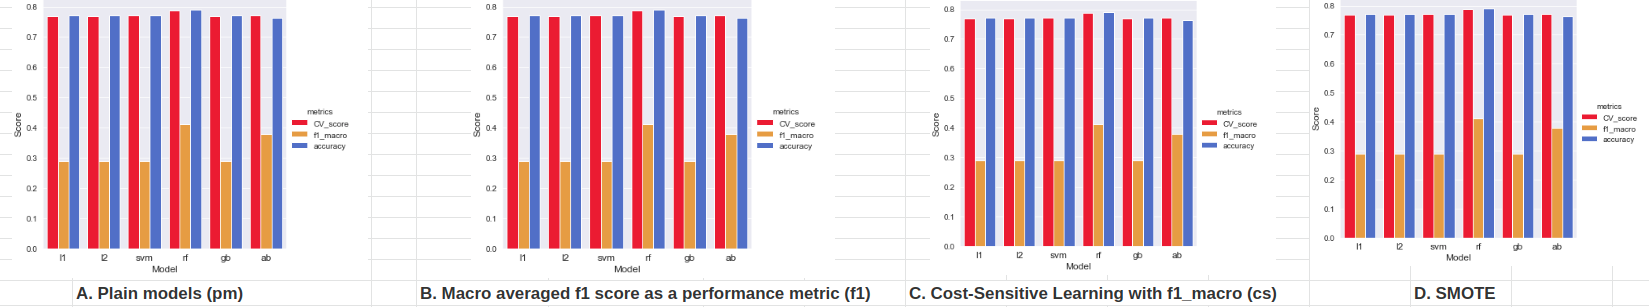
My dataset was relatively small and imbalanced and I had to employ several techniques for handling imbalanced classes:
- f1 macro averaged score for performance metric
- cost-sensitive learning (penalize algorithms)
- SMOTE - Synthetic Minority Over-sampling Technique
I have used six machine learning algorithms: $L_1$ and $L_2$ regularized Logistic Regressions, SVM and three tree ensembles, Random Forest, Gradient Boost and AdaBoost.
In total, I have trained 22 models.
- Plain models, without any of the above listed techniques, did prety bad with predicting minority classes. They mostly predicted the majority class. Because of that, their accuracy score was high, but f1-macro score was low. As expected, tree ensembles models, were performed slightly better.
- All three techniques listed above, made a positive difference. Again, tree ensemble models produced better performance.
- I could not find one single health condition that could alone increase the risk of being diagnosed with type 2 diabetes.
- It looks that they are working differently for different people.
- From my limited sample, I could conclude that the most contributing factors were age, cholesterol ratio and waist cirumference.
Winning model
The Random Forest model with cost-sensitive learning have produced the best performance:
- prety good on the majority class - recall=0.83
- on the diabetes class not so bad - recall=0.58
- not so good on the smallest, pre-diabetes, class - recall=0.29
It is interesting to note the following regarding predicting pre-diabetes:
- there were only 7 labels in the test set
- recall=0.29 means 2 successfully predicted labels and in addition to my winning model, only 3 models had this score: Gradient Boost, Random Forest and SVM all with SMOTE
- only 2 models succeded in 3 positive prediction, recall=0.43. Surprisingly, that was $L_2$-regularized Logistic Regression with SMOTE and cost-sensitive learning.
Possible Improvements and Expansions
These are some of possible improvements/expansions for this project:
- Acquire a bigger dataset so that the smallest class will have more than 7 points in the test set. And maybe, a bigger sample could produce different relationships among the features.
- Additional hyperparameters tuning on few best performing models
- Perform additional feature selection and dimensionality reduction (PCA)
References
- Using Smote with Gridsearchcv in Scikit-learn
- Model evaluation: quantifying the quality of predictions
- Exploring class imbalance, resampling and weights
- Multiclass classification using scikit-learn
- Evaluating a Classification Model
- How to Handle Imbalanced Classes in Machine Learning
- Dealing with Imbalanced Data
- A Deep Dive Into Imbalanced Data: Over-Sampling
- Hemoglobin A1c (HbA1c) Test for Diabetes
- Type 2 diabetes
- Rethinking A1c goals for type 2 diabetes
- About Adult BMI
- Why is the hip-waist ratio important?
- What Is Cholesterol Ratio?
- Hypertension Chart - Understanding Your Blood Pressure
- Waist Size Predicts Diabetes Risk
comments powered by Disqus